
As a business owner, ensuring that your company is moving in the right direction and meeting its short- and long-term goals is paramount. Achieving this requires a diligent check on operations to identify and remove inconsistencies that may be hampering business performance, either directly or indirectly. Data has become a highly valuable asset over the years, providing businesses with a true picture of their organization’s performance. However, scattered or unstructured data carries little to no value and requires cleaning to obtain meaningful insights. As data volumes increase, cleaning becomes a more complex and resource-intensive process.
By using the right business intelligence (BI) tools and technologies, companies can effectively manage their raw data and convert it into relevant, accurate, and actionable data. And the answer to this whole scenario is using Power BI.
What is Power BI?
Power BI is a technology-driven business intelligence tool developed by the tech giant Microsoft that allows companies to aggregate, visualize, and analyze their data to get valuable insights. The data is presented in the form of user-friendly and intuitive reports, dashboards, charts, and graphs for quick analysis. By using Power BI, businesses can identify current or potential issues, understand market trends, and find new opportunities to boost their ROI.
How does Power BI benefit your business?
Deploying business intelligence technologies like Power BI can benefit your business in several ways. Let’s talk about the 5 Power BI features that make it the ultimate data visualization tool.
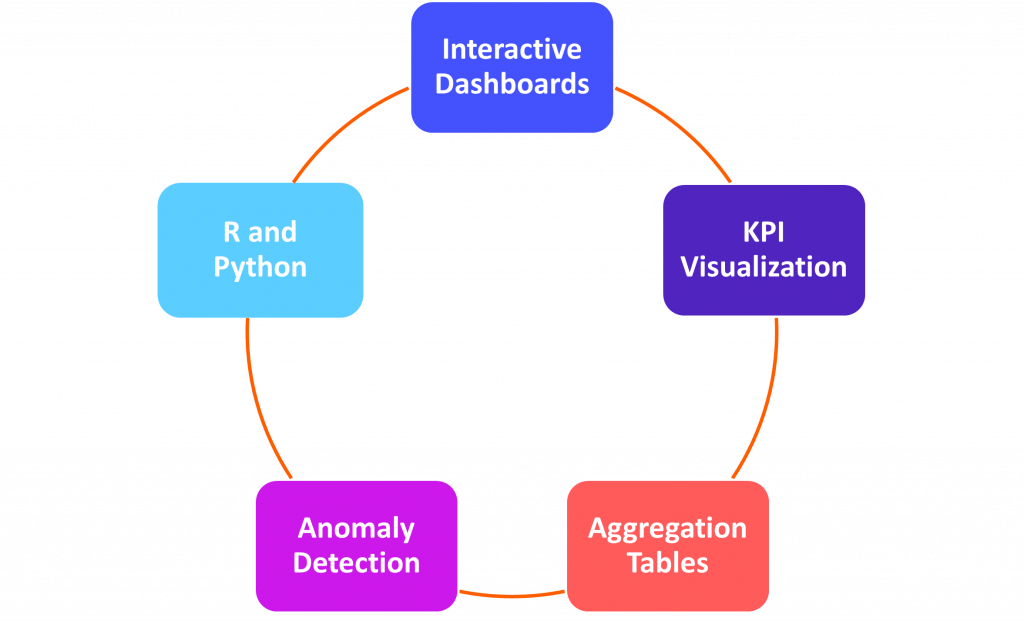
- Interactive Dashboards – One of the key features of Power BI, dashboards are a way to have a look at your different business metrics at one glance. Only one page in size, dashboards use visualizations to highlight different aspects of a story through tiles, which are essentially reports generated from underlying datasets. Users can pin these tiles to their secured dashboards from different reports and simply click on them if detailed information is required. In addition to being clean, colorful, and simple, the tiles are highly interactive with charts and graphs and get updated automatically as soon as the data changes.
- KPI Visualization – For every business, it is extremely important to keep a check on how it is progressing towards its target in different areas. That’s why they have Key Performance Indicators (KPIs) in place. Power BI KPI allows businesses to easily compare the current value status of a metric against a pre-set target along with a base value. For example, you can evaluate your gross sales against projected gross sales for a selected duration. In addition to tracking and managing KPIs, KPI visualization also helps in understanding trends for strategic decision-making. Additionally, we can configure alert on top of the KPIs. This allows Power BI to send notifications via email or SMS in case a KPI breaches a threshold value. So Power BI effectively allows all-time monitoring over KPIs- online and offline.
- Aggregation Tables – It is a useful features of Power BI for handling large datasets efficiently. Unlike Excel spreadsheets, which have a limit of just over 1.04 million rows, it can handle datasets with more than 100 million rows. Using Excel sheets with data in over a million rows can cause significant delays when rendering reports, making the whole process slow. However, aggregation tables use pre-calculated data to render reports faster and speed up queries, making Power BI a much better choice for analyzing large datasets. Power BI offers an easy and intuitive GUI which allows configuring data presentation as well as aggregation options at multiple levels. It also houses a powerful DAX query language that allows complex calculations over multiple data tables. All of this is possible due to VertiPag storage engine which due to its in-memory and columnar nature allows Power BI to crunch millions of rows in a matter of seconds.
- Anomaly Detection – Another cool features of Power BI is automatic anomaly detection. It allows businesses to get instant alerts when the system detects anomalies in time series data in line charts. If required, you can even find explanations for the anomalies in gauges, KPIs, and cards in dashboards to analyze the root cause of the problem with drill-down reports. Full customization options allow businesses to set what should or should not be treated as an anomaly, and also make changes to the size, shape, and color of the anomalies.
- R and Python – By using programming languages such as R and Python, businesses can further extend the capabilities of Power BI. They help you simplify data ingestion and enhance dashboards for richer insights and analysis. Both R and Python can be used to perform data transformation tasks, such as normalizing the data, which can be a hassle in Power Query. We can also leverage existing Cognitive services models or an organization’s ML APIs right inside the Power BI.
A few other important features of Power BI include easy sharing of dashboards and reports for better collaborations within or outside the organization and accessibility on mobile devices for analysis on the go.
Although Power BI is one of the best tools out there when it comes to self-service data visualization, there are other alternatives also available such as Tableau, QlickSense, Dundas BI, Sisense, etc., which offer more or less similar services.
Some Industry use cases
It is a versatile business intelligence tool that can be used across various industries. Here are some industry-specific use cases of Power BI:
- Finance– It can be used to consolidate and analyze financial data from multiple sources, such as bank accounts, credit cards, and accounting software. This allows finance professionals to gain insights into revenue, expenses, and cash flow, and make data-driven decisions about budgeting and forecasting.
- Sales and Marketing-It is best to analyze sales data, customer behavior, and marketing campaigns. Sales and marketing professionals can use this information to identify trends, measure the effectiveness of their strategies, and optimize their approach to customer acquisition and retention.
- Healthcare- Power BI can be used as an added advantage to analyze patient data, clinical outcomes, and operational metrics in healthcare organizations. This allows healthcare professionals to identify areas for improvement, track performance against industry benchmarks, and optimize patient care and outcomes.
- Manufacturing- It can be used to monitor production processes, track inventory levels, and optimize supply chain operations. This allows manufacturers to identify opportunities for cost savings, improve efficiency, and meet customer demand.
- Human Resources– It can be used to track key performance indicators for HR, such as employee retention, recruitment metrics, and workforce diversity. This allows HR professionals to identify areas for improvement and make data-driven decisions about talent management.
- Retail- This sector is so vast, and Power BI can be used to analyze sales data, inventory levels, and customer behavior in retail environments. Retailers can use this information to optimize their product offerings, pricing strategies, and promotions, and improve the overall customer experience.
- Education- In this, it can be used to track student performance, analyze enrollment data, and monitor budgets in educational institutions. This allows educators to identify areas for improvement, optimize operations, and improve student outcomes.
- Energy and Utilities– This sector requires a real analysis of data and Power BI can be used to monitor energy consumption, analyze operational data, and track key performance indicators in energy and utility companies.
- Transportation and Logistics– It can be used to track supply chain operations, analyze shipping data, and monitor fleet performance in transportation and logistics companies. This allows companies to optimize their operations, reduce costs, and improve overall performance.
Challenges of Implementing Power BI solution
While Power BI is a powerful tool that provides many benefits, it can also present some challenges. Here are some common challenges of Power BI solutions:
- Data quality and consistency– Power BI relies heavily on the quality and consistency of the data it analyzes. If the data is incomplete, inaccurate, or inconsistent, the resulting reports and visualizations may be misleading or difficult to interpret.
- Security- It is a main concern of any business and a solution based on Power BI may contain sensitive data that requires robust security measures to protect against unauthorized access or data breaches.
- User adoption- Power BI solutions can be complex and require a certain level of technical expertise to use effectively. This can present challenges in terms of user adoption, training, and support.
- Scalability-As data, volumes grow, Power BI solutions may struggle to scale to accommodate the increased demand for processing power and storage capacity
- Customization- While Power BI provides many built-in features and visualizations, it may not meet an organization’s unique needs. Customization may require additional development effort and resources.
- Cost- Power BI is a licensed product, and the cost of licensing and deploying a Power BI solution can be significant for some organizations.
So how to manage all these challenges?
As with any solution, Power BI comes with its own set of challenges. Above, we highlighted some common challenges that organizations may encounter when implementing Power BI solutions. To overcome these challenges, it is important to adopt a systematic and tested approach. Let’s discuss some remedial measures that organizations can take to tackle these challenges:
- Uniform Data standards– As data quality and consistency is priority, organizations should establish clear data quality standards and processes, which may include data validation, cleansing, and enrichment. Also, regular monitoring and auditing of data sources for consistency and accuracy is critical.
- Uniform Security plan-When it comes to security, organizations must develop a uniform security plan that includes access control, authentication, and data encryption. This plan should also include security measures such as multi-factor authentication, role-based access control, and data classification. and regular review and update of security policies and procedures are also necessary to address new threats and vulnerabilities.
- Uniform Expertise-For better user adoption, uniform training, and support should be practiced. Also developing user-friendly reports and visualizations that are easy to interpret and understand is key. Fostering a culture of data-driven decision-making within the organization can help drive user adoption.
- Uniform Scalability-For this organization, we should consider scalable cloud-based infrastructure and regularly monitor and optimize performance to ensure scalability.
- Uniform Customization- Uniform or unique customization is the prime concern of a customer so to address this, organizations should identify and prioritize customizations needed and leverage Power BI’s open architecture to integrate with other systems and data sources. Working with experienced developers and consultants can also help build custom solutions that meet specific needs.
- Uniform Cost-Overrated costs are a major hindrance, so for that, organizations should evaluate their budget and ROI expectations when choosing licensing and deployment options. Cloud-based solutions with flexible pricing models based on usage can also be considered to reduce unnecessary expenses.
Final thoughts
So finally, we can say that Power BI is something that can act as a catalyst to grow your business ta high-end but addressing the above challenges requires careful planning, technical expertise, and ongoing support and maintenance.
Knowing what the right tools and technologies for your company are can help you get the most out of your business. Our highly experienced team can help you create interactive dashboards and analytics reports so you can easily track and manage your KPIs. Depending on the requirement, the dashboards can be customized at different levels for better collaboration or highly secure for only authorized access.
Overall, leveraging BI solutions can provide organizations with a 360-degree view of their operations, allowing them to make data-driven decisions to drive growth and achieve their business objectives. By partnering with Contata, organizations can benefit from the latest data-driven BI solutions to take their business intelligence to the next level.