Real-Time Geospatial Intelligence for Connected Operations
Today you monitor devices. We help you monitor areas of impact.
Most organisations can tell you which device is down. Fewer can tell you where the impact lands, which segment is blind, which coverage gap is about to become an incident. The QGIS Device Intelligence Platform adds location to your existing monitoring stack, turning raw telemetry into real-time geographic insight.

Real-Time Visibility & Monitoring
Every connected device is mapped live, position, status, and connectivity health, color-coded, and always current. Coverage-gap and dead-zone detection distinguish network failures from device faults, surfacing problems as they occur rather than after the fact. Manual polling has been replaced by a single source of operational truth.
Spatial Zone Intelligence & Voronoi Analytics
Automatic Voronoi partitioning transforms scattered device points into structured operational geography, mapping each device's zone of influence and surfacing coverage gaps, overlaps, and density imbalances at a glance. Historical trails add journey replay, route reconstruction, and incident documentation. The operating picture shifts from "Sensor A, B, C are down" to "Segment X is blind."

Decision Intelligence & Proactive Response
Spatial trend analysis, hotspot detection, and predictive indicators give operations leaders the geographic evidence to act ahead of demand rather than react to it. Configurable geofencing and anomaly-detection alerts route events to the right people before incidents escalate, through role-based GIS dashboards and an auditable detection-to-resolution workflow.
Our Strategic Roadmap to Implementation
A geospatial device intelligence engagement that begins with deployment before alignment accumulates operational gaps faster than it closes them. Our four-phase delivery framework is designed to start focused, with a targeted pilot on one corridor, basin, or terminal cluster, and expand as the platform proves its value on your actual operational data.
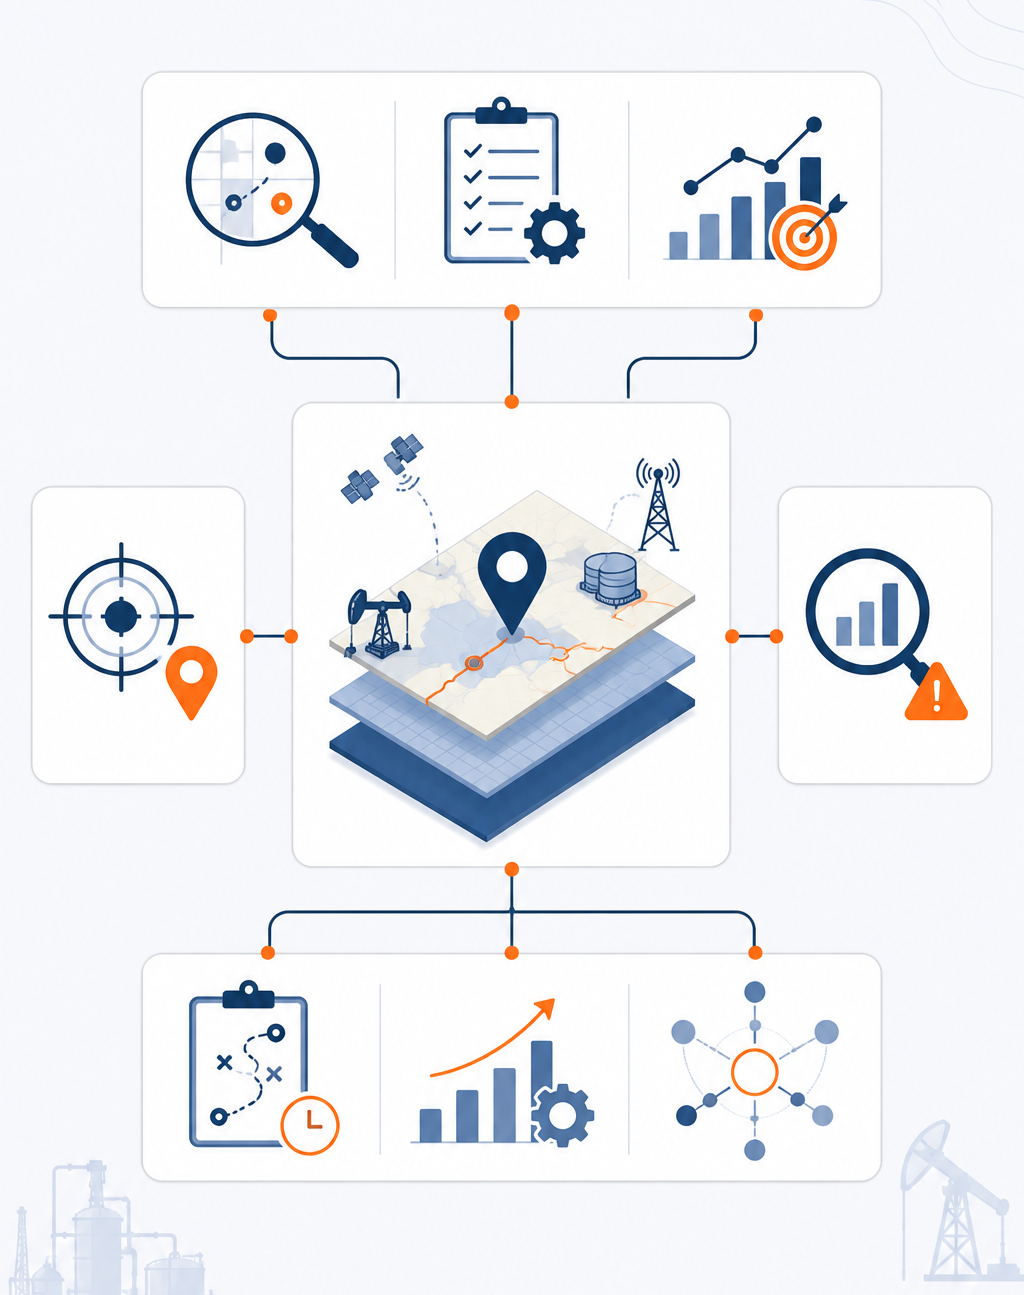
Discovery & Operational Assessment
Establish your operational baseline and identify the highest-value services before any deployment begins.
The single most common reason geospatial monitoring programmes underdeliver is beginning deployment before completing the operational audit. We map your existing asset estate, telemetry sources, connectivity data, and monitoring gaps before a single map layer is built, producing a complete picture of your current baseline, an assessment of the services that will deliver the highest immediate value, and a risk-prioritised delivery sequence that tells the programme where to start and why. Engagements typically begin with a focused pilot on one corridor, basin, or terminal cluster, expanding to broader deployment as the platform validates against real operational data.
Asset & Telemetry Inventory
Identify every connected asset, data source, and connectivity feed that will inform the platform, and assess the quality and completeness of each.
Monitoring Gap Analysis
Map the gaps between your current device-level visibility and the area-level coverage intelligence your operations require.
Service Prioritization
Score each service area by operational urgency and delivery complexity to drive the sequence that delivers the most value earliest.
Spatial Architecture & Data Integration
Define the target geospatial architecture and connect your data sources before the first live map goes live.
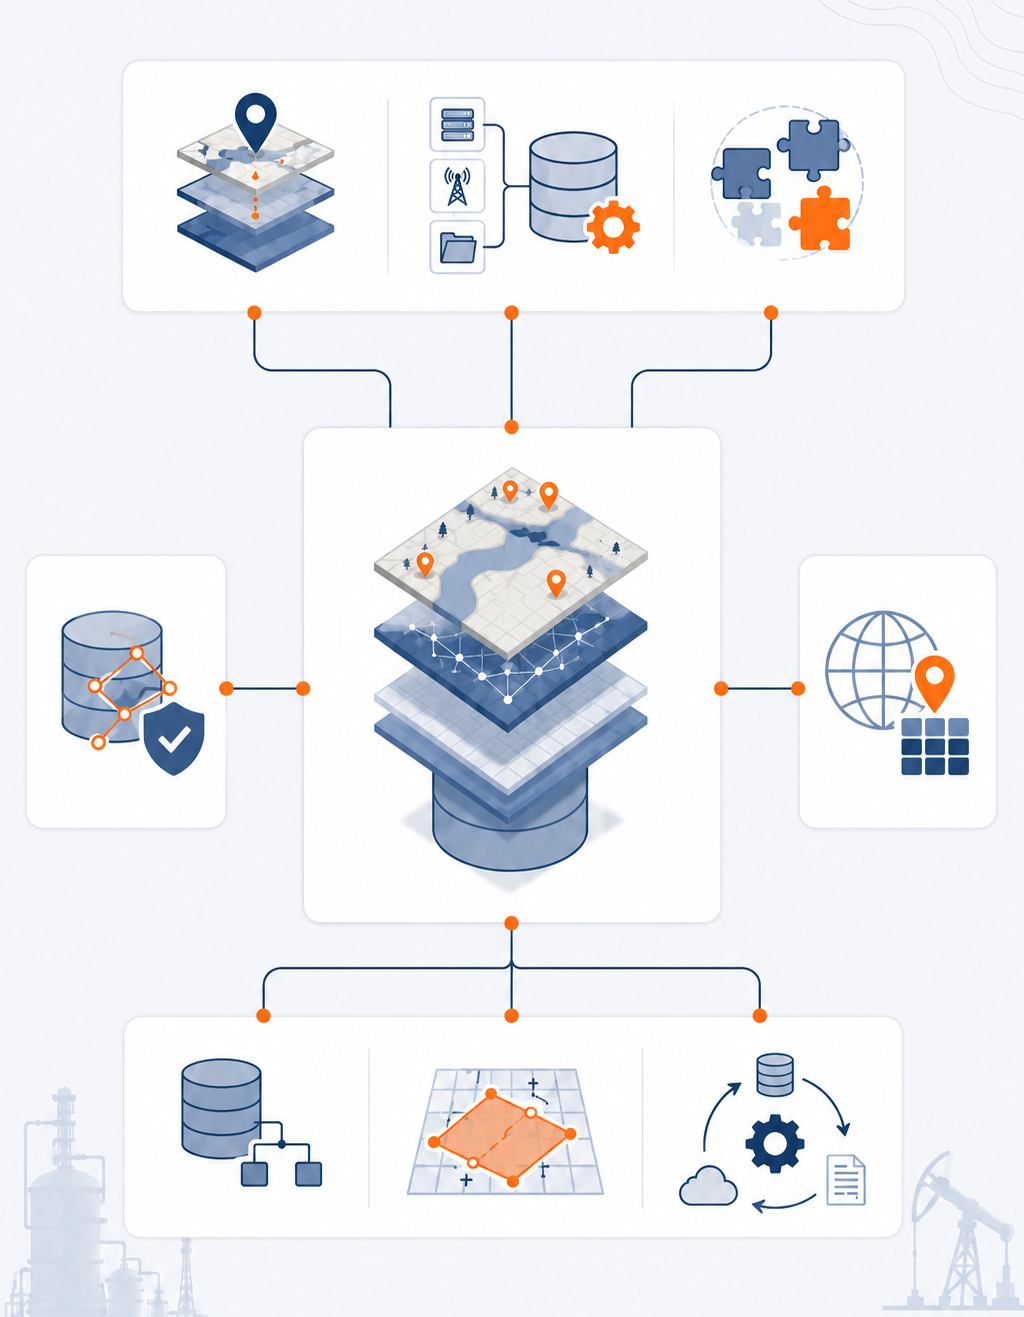
Reactive architectural decisions during deployment create the rework that blows timelines and budgets. We define the full spatial data architecture before integration work begins, specifying the GIS layer structure, PostGIS schema, device positioning methodology, and coverage zone computation model. Every data source is connected, every integration boundary is defined, and the platform is configured to update in real time before any operational users see the map.
GIS Layer Architecture
Specify the map layer structure, coordinate systems, and PostGIS spatial schema that the monitoring platform will run on.
Device Positioning Configuration
Configure the IP geolocation, GPS, and manual site mapping combination that correctly positions each device in your operational geography.

Telemetry Integration
Connect device telemetry, connectivity data, and asset records to the monitoring API and validate data quality before go-live.
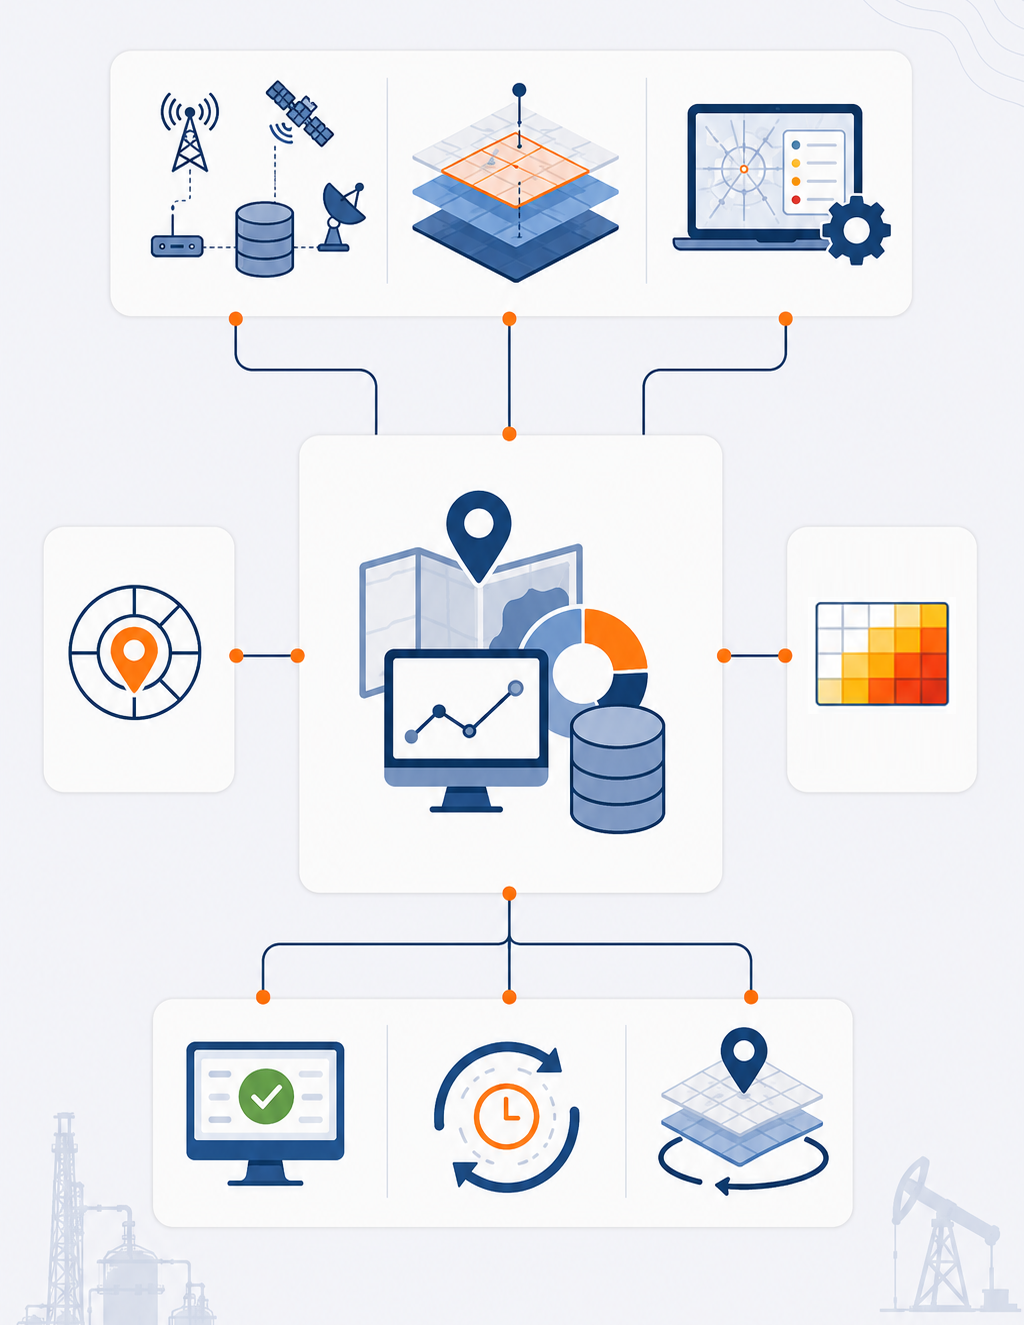
Live Map Deployment & Zone Intelligence
Deploy the real-time monitoring map and activate coverage zone intelligence across your operational geography.
With architecture defined and data flowing, we deploy the QGIS Device Intelligence Platform, starting with the highest-priority device populations and coverage areas identified in Phase 1. Each device appears on the map as a colour-coded status point, coverage zones partition the geography automatically, and connectivity health layers surface dead zones in real time. Every deployed layer is validated against real operational data before it reaches your team, and the platform is configured for automatic refresh so the operating picture stays current without manual intervention.

Real-Time Device Map
Deploy live colour-coded device status points, active (green) or inactive (red), with last-reported timestamps, staleness indicators, and on-click device detail across your operational geography.

Coverage Zone Partitioning
Activate automatic coverage zones from live device locations, Voronoi for area/density assets, segment-based for linear pipelines, with per-zone metrics, gap detection, and overlay with administrative or custom boundaries.

Connectivity Health Layers
Deploy colour-coded connectivity health maps, High, Moderate, Low, and No connectivity, distinguishing device faults from network coverage failures, with dead-zone detection and signal-quality classification.
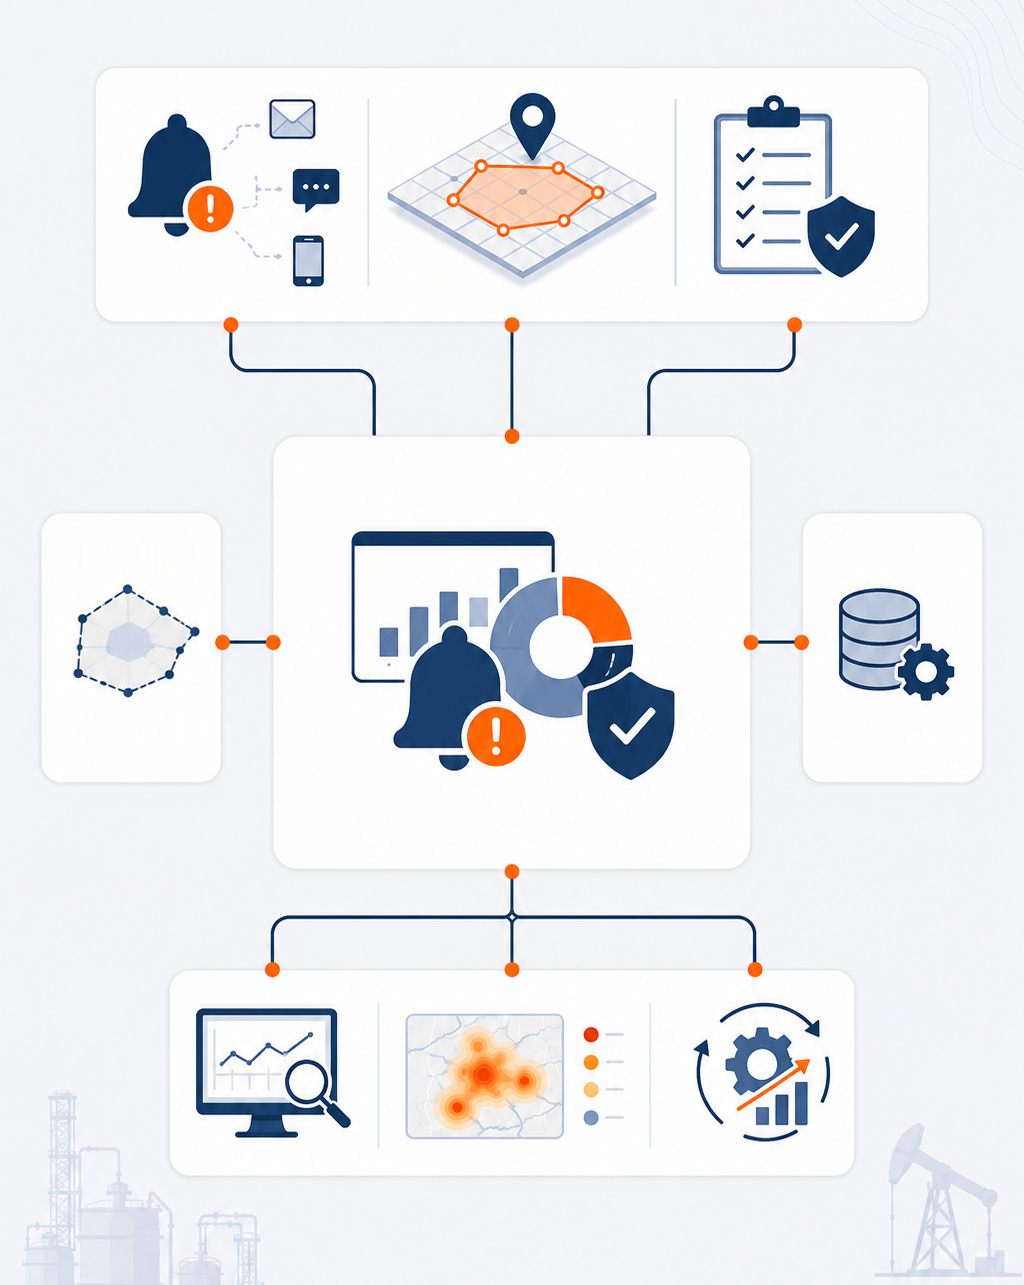
Alerting, Analytics & Operational Governance
Activate proactive alerting, decision intelligence, and govern the platform through structured, measurement-driven delivery.
A monitoring platform that surfaces data without enabling decisions has traded one problem for another. We configure the alerting rules, geofencing boundaries, and exception-management workflows that turn continuous monitoring into proactive action, routing events to the right people before incidents escalate, with a full audit trail for every detected exception. Alongside alerting, we activate the analytical layer: spatial trend analysis, hotspot detection, and resource optimisation indicators. Every capability addition is regression-tested and deployed with rollback procedures.

Alerting & Exception Management
Configure geofencing rules, connectivity-failure detection, and movement-anomaly alerts with multi-channel notification, tiered escalation, and an auditable detection-to-resolution workflow.
GIS Dashboards & Decision Support
Deploy role-based dashboards for operational, tactical, and executive audiences, with live KPI widgets, drill-down navigation, and configurable reporting and exports.
Analytics & Optimization
Activate spatial trend analysis, hotspot detection, resource utilization measurement, and operational indicators derived from historical patterns, with scenario comparison and capacity planning models.
Case Studies
Trusted by leading brands across the globe. Know how Contata helped companies drive more value to their businesses with top-notch Data Science, App Development, and Marketing solutions.



.png)




Featured Insights


Trusted Partners in Achieving Excellence
For over 25 years, Contata has been the behind-the-scenes partner that ambitious businesses rely on, embedded at every level, from strategy to delivery, to make every project succeed. And we do it cost-effectively.